
©2024 Pacific Gas and Electric Company
Urgent Alert
Outage Center
Report an outage. View the outage map. Get the status of current planned and unplanned outages.
Outage preparedness and support
Stay prepared for power and gas outages and get support.
Safety
Get information about gas and electrical safety in your home, yard, business and more.
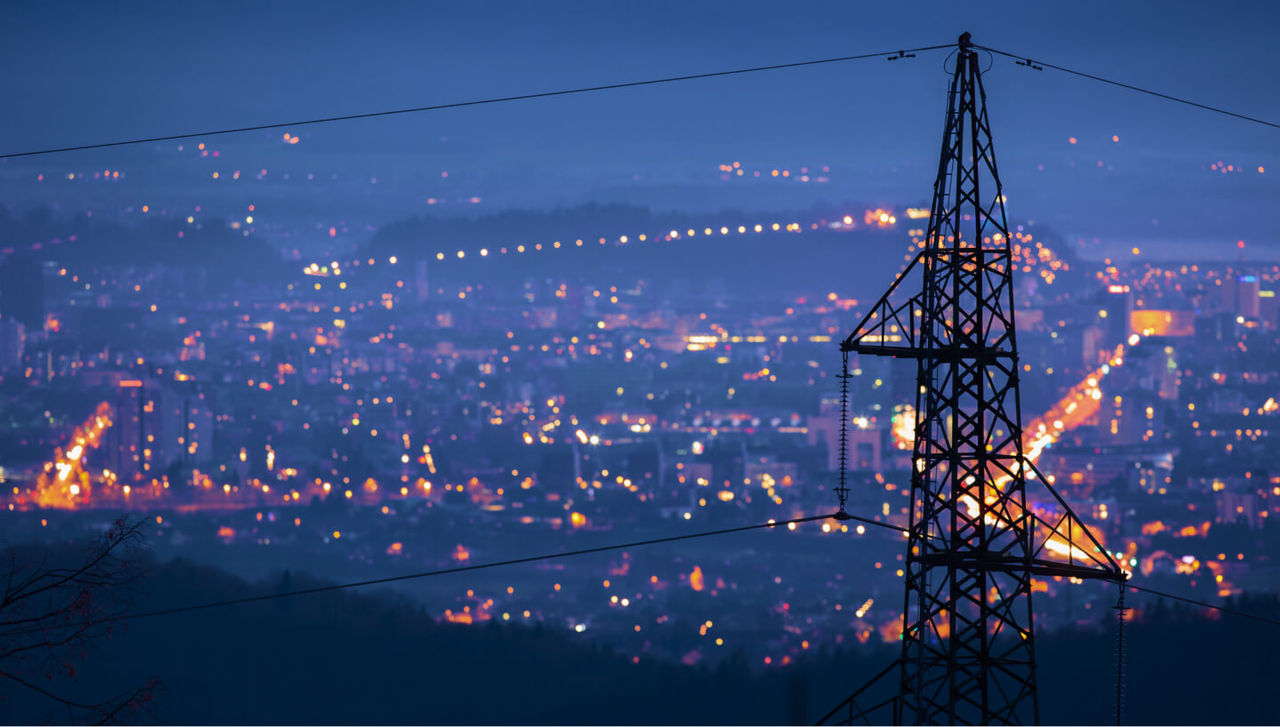
Why do electric outages happen?
Learn how electrical outages can impact your home or business. Discover how we turn the power back on.
More on outages and safety
Safety Action Center
Create an emergency plan. Stay informed to stay safe.
Report It mobile app
Use the PG&E mobile app to report non-emergency safety concerns.
Community Wildfire Safety Program
Find out how we're making our system safer and more reliable.