"PG&E" refers to Pacific Gas and Electric Company, a subsidiary of PG&E Corporation. © 2023 Pacific Gas and Electric Company. All rights reserved.
California Gas Transmission
Pipe Ranger
OFO/EFO Outlook
| Date | OFO/EFO | Reason |
|---|---|---|
| 04/29/2024 | No OFO | |
| 04/30/2024 | No OFO | |
| 05/01/2024 | No OFO | |
| 05/02/2024 | No OFO |
Pipeline Status
Plan 3, posted 04:03 PM PT
Last updated for the Gas Day of 05/01/2024. Next update expected by 11:00 PM PT. (The Gas Day runs from 7:00 AM to 7:00 AM PT).
Scheduling Status
|
|
Unprocessed
Processing
Confirmed
Scheduled
System Inventory Status
| Ending Inventory History | Ending Inventory Forecasts | ||||||
|---|---|---|---|---|---|---|---|
| MMcf | |||||||
Recent News Articles
Potential Hold On Constraint and Path Limits - 3/15/24
March 15, 2024 at 07:03 a.m.
ID1 set to Evening cycle ...
A Hold On Constraint and Path Limits - 3/14/24
March 14, 2024 at 09:08 a.m.
ID1 set to Evening cycle ...
Springing Forward on March 10, 2024
March 08, 2024 at 07:00 a.m.
Time changes Sunday, 2:00 a.m ...
Physical Pipeline Capacity
|
Physical Pipeline Capacities As of
(Receipt Point Capacity, )
|
||
|---|---|---|
|
Redwood Path |
||
|
Redwood Path Capacity |
||
|
From Gas Transmission NW |
||
|
From Ruby |
||
|
Baja Path | ||
|
Baja Path Capacity – Topock |
||
|
Baja Path Capacity – Hinkley |
||
|
Baja Path Capacity – Kettleman |
||
|
From KRGT - HDL |
||
|
From KRGT - Daggett |
||
|
From SoCalGas |
||
|
From El Paso Natural Gas |
||
|
From Transwestern |
||
|
Off-System | ||
|
To SoCalGas |
||
|
To KRGT - HDL |
||
Scheduled Volumes
| All Volumes in Dth | ||
|---|---|---|
| Cycle | Cycle | |
|
Redwood Path | ||
|
From Gas Transmission Northwest |
||
|
From Ruby |
||
|
Total Redwood Path |
|
|
|
Baja Path | ||
|
From KRGT-HDL |
||
|
From KRGT-Daggett |
||
|
From SoCalGas |
||
|
From El Paso Natural Gas |
||
|
From Transwestern |
||
|
Total Baja Path |
|
|
|
Off-System | ||
|
To SoCalGas |
||
|
To KRGT-HDL |
||
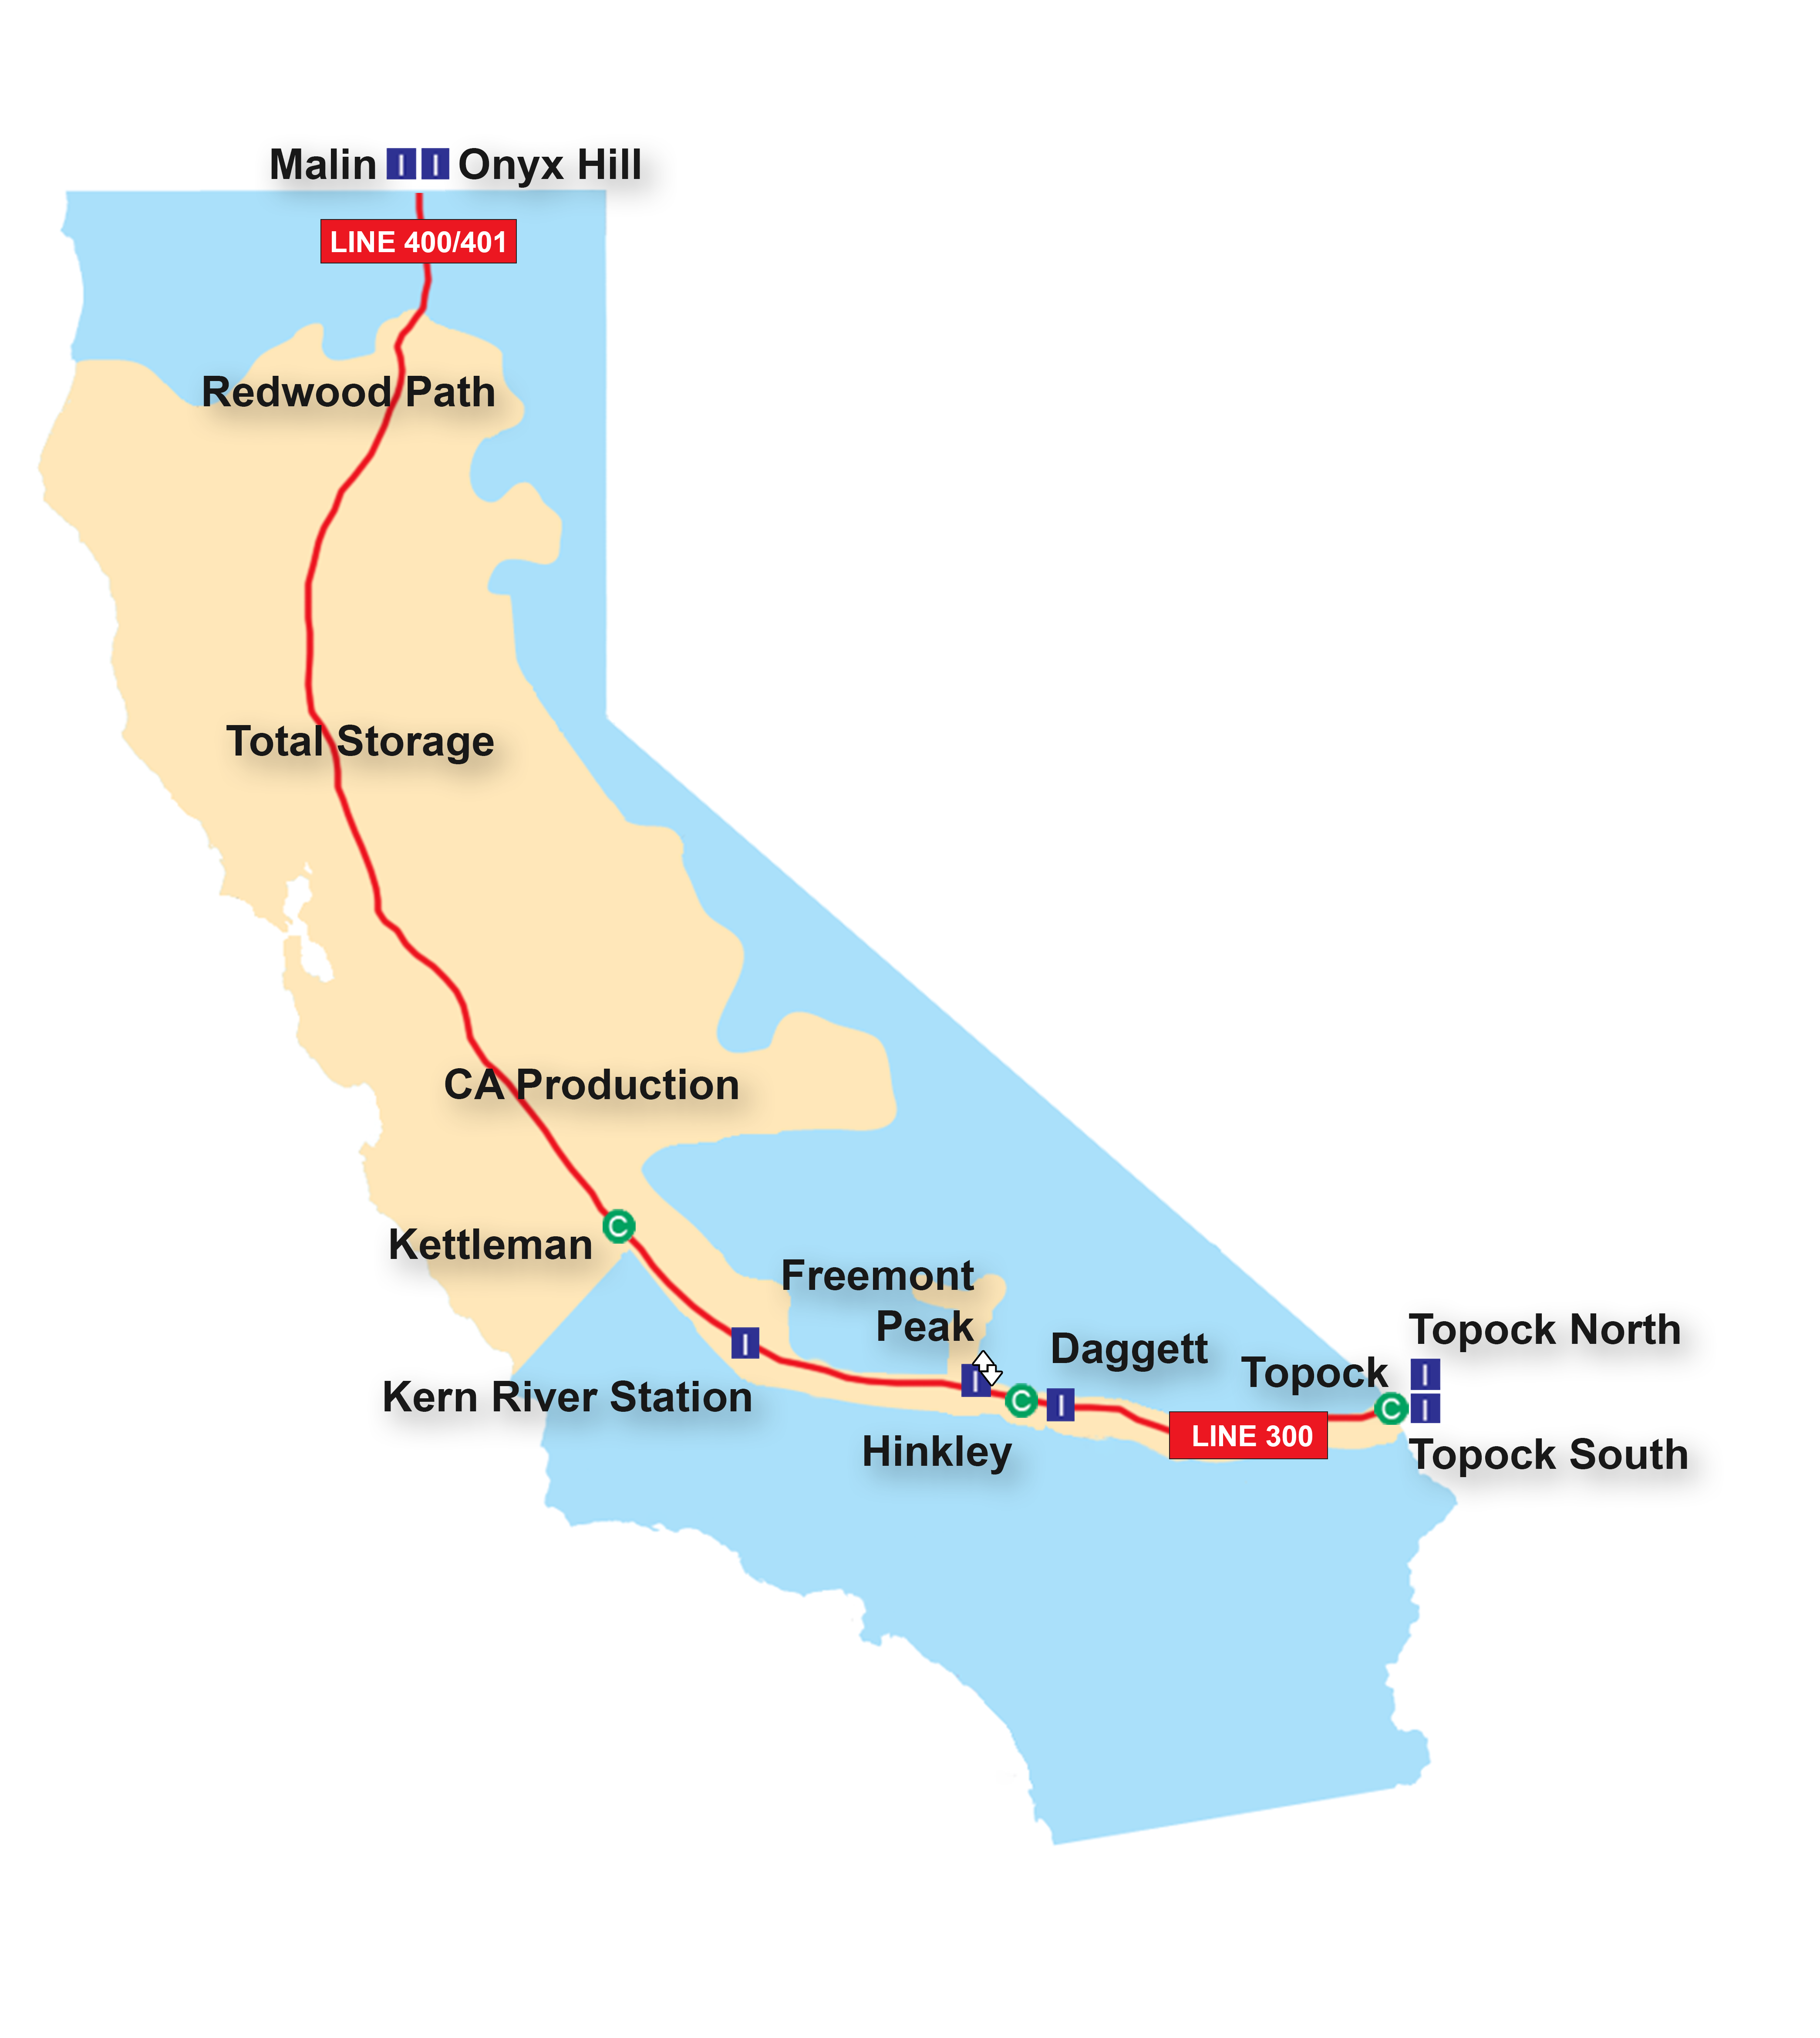
Interactive Pipeline Map
All volumes are expressed in Dth.
All areas on the map activate on hover. Clicking a selection makes the location stay on screen.
Download Features Provided
Select Date
* Please enter any date after 07/26/2021 in MM/DD/YYYY format.
* This download feature provides a previous gas day’s final Physical Pipeline Capacity and Scheduled Volumes information.
* Yesterday's downloadable information is available after 8:00 a.m. Pacific time.
Pipeline Maintenance
| Capacity in MMcf/d | ||
|---|---|---|
| Dates | Redwood Path | Notes |
|
April 26 |
2190 |
Indian Springs Station Maintenance Delevan Station Maintenance |
|
April 27 - 28 |
2170 |
Indian Springs Station Maintenance |
|
April 29 - 30 |
2000 |
Indian Springs Station Maintenance Buckeye Station Maintenance |
|
May 01 - 07 |
1880 |
Indian Springs Station Maintenance Buckeye Station Maintenance |
|
May 08 |
1870 |
Indian Springs Station Maintenance Buckeye Station Maintenance Tionesta Station Maintenance Burney Station Maintenance |
|
May 09 |
1850 |
Indian Springs Station Maintenance Buckeye Station Maintenance Burney Station Maintenance |
|
May 10 |
1860 |
Indian Springs Station Maintenance Buckeye Station Maintenance Burney Station Maintenance |
|
May 11 - 13 |
1880 |
Indian Springs Station Maintenance Buckeye Station Maintenance |
|
May 14 |
1880 |
Indian Springs Station Maintenance Buckeye Station Maintenance Ruby Station Maintenance |
|
May 15 |
1690 |
Indian Springs Station Maintenance Buckeye Station Maintenance Ruby Station Maintenance |
|
May 16 - 28 |
1880 |
Indian Springs Station Maintenance Buckeye Station Maintenance |
|
May 29 |
1770 |
Indian Springs Station Maintenance Buckeye Station Maintenance Antioch Station Maintenance |
|
May 30 - 31 |
1880 |
Indian Springs Station Maintenance Buckeye Station Maintenance |
| Capacity in MMcf/d | ||||
|---|---|---|---|---|
| Dates | Kettleman | Hinkley | Topock | Notes |
|
April 24 - 28 |
380 |
920 |
780 |
Kettleman Station Maintenance Hinkley Station Maintenance |
|
April 29 - 30 |
380 |
920 |
780 |
Kettleman Station Maintenance Topock Station Maintenance Hinkley Station Maintenance |
|
May 01 - 06 |
380 |
920 |
780 |
Kettleman Station Maintenance Topock Station Maintenance Hinkley Station Maintenance |
|
May 07 - 09 |
380 |
920 |
975 |
Kettleman Station Maintenance Hinkley Station Maintenance |
|
May 10 - 13 |
500 |
920 |
975 |
Kettleman Station Maintenance Hinkley Station Maintenance |
|
May 14 - 24 |
500 |
250 |
975 |
Hinkley Station Maintenance |
|
May 25 - 31 |
500 |
920 |
975 |
Hinkley Station Maintenance |
Limitations at Specific Interconnect Points
Redwood Path
| Dates | Capacity | Notes |
|---|
Capacity information is in MMcf/d
Baja Path
| Dates | Capacity | Notes |
|---|---|---|
|
April 01 - 30 |
713 |
El Paso Interconnect at Topock limited for maintenance |
|
May 01 - 31 |
713 |
El Paso Interconnect at Topock limited for maintenance |
Capacity information is in MMcf/d
Storage Maintenance
Injection
| Dates | Available Injection | Notes |
|---|
Capacity information is in MMcf/d
Withdrawal
| Dates | Available Withdrawal | Notes |
|---|
Capacity information is in MMcf/d
Forecasts
Supply and Demand
| Forecast for | Forecast for | |
|---|---|---|
|
COMPOSITE TEMPERATURE Historical Average for current day: 60.1 |
||
| Demand | ||
| On-System Demand | ||
| Off-System Deliveries | ||
| SoCal Gas KRS | ||
| Southwest Gas | ||
| Kern River GT - HDL | ||
| Transmission Shrinkage | ||
| Injection | ||
| PG&E Storage Injection (208 Maximum)* | ||
| Wild Goose Storage | ||
| Central Valley Storage | ||
| Lodi Storage | ||
| Gill Ranch Storage | ||
| Total System Demand | ||
| Supply | ||
| Interconnect Supply | ||
| Gas Transmission Northwest | ||
| Ruby | ||
| California Production | ||
| SoCal Gas (KRS) | ||
| Kern River GT - HDL | ||
| Kern River GT - Daggett | ||
| Southern Trails | ||
| El Paso Natural Gas | ||
| Transwestern | ||
| Withdrawal | ||
|
PG&E Storage Withdrawal (408 Maximum)* Core, Market Center, and Pipeline Balancing |
||
| Wild Goose Storage | ||
| Central Valley Storage | ||
| Lodi Storage | ||
| Gill Ranch Storage | ||
| Total System Supply | ||
| Inventory Change (Supply - Demand) | ||
| Total Customer Imbalance | ||
Storage Activity
|
Forecast for |
Forecast for |
|
|---|---|---|
| Injection | ||
| PG&E StorageCore and Market Center | ||
| Wild Goose Storage | ||
| Central Valley Storage | ||
| Lodi Storage | ||
| Gill Ranch Storage | ||
| Pipeline Balancing Injection | ||
| Withdrawal | ||
| PG&E StorageCore and Market Center | ||
| Wild Goose Storage | ||
| Central Valley Storage | ||
| Lodi Storage | ||
| Gill Ranch Storage | ||
| Pipeline Balancing Withdrawal | ||